English
Introduction
In a distributed system such as a landscape of cooperating microservices, it is important to be able to track and visualize the path of requests and messages during the processing of an external call. For this purpose, Spring Cloud Sleuth offers a feature that allows marking requests and messages of the same processing flow with a common correlation ID. This feature can also decorate log records with correlation IDs to facilitate tracking of records from different microservices.
Zipkin is a distributed tracing system to which Spring Cloud Sleuth can send tracing data for storage and visualization. The distributed tracing information in Spring Cloud Sleuth and Zipkin is based on Google Dapper, which defines a trace tree and scopes identified by a TraceId and a SpanId.
In 2010, Google published the paper on Dapper, which it has been using internally since 2005. In 2016, the OpenTracing project joined the CNCF, providing vendor-agnostic APIs and language-specific libraries to instrument distributed tracing. In 2019, the OpenTracing project merged with the OpenCensus project to form a new CNCF project, OpenTelemetry, which provides a set of libraries for collecting distributed metrics and traces.
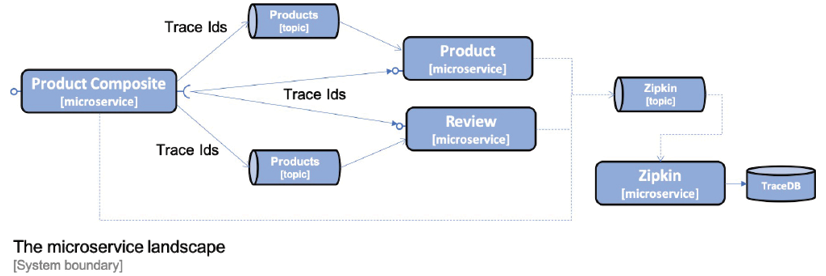
Spring Cloud Inspector allows sending requests to Zipkin synchronously via HTTP or asynchronously using RabbitMQ or Kafka. To avoid creating runtime dependencies on the Zipkin server from microservices, it is recommended to send information to Zipkin asynchronously using RabbitMQ or Kafka. The following diagram illustrates this approach:
The following is a screenshot of ZipkinUI, which visualizes the trace tree that was created as a result of processing an aggregate product creation:
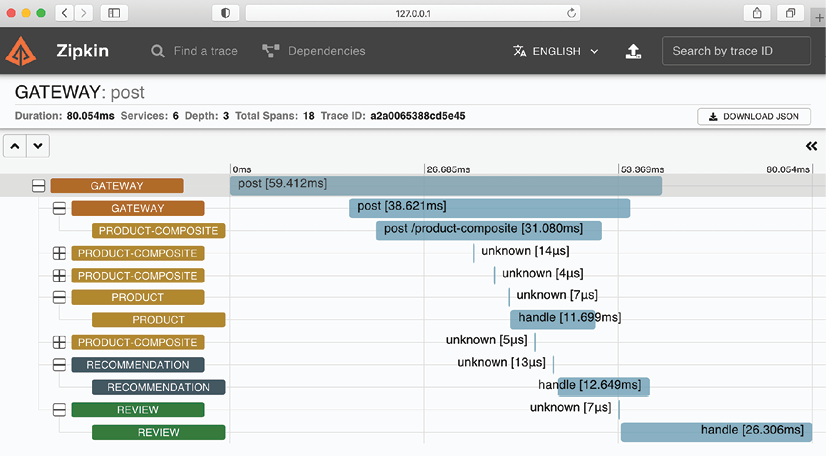
The screenshot shows that a POST request is sent to the product-composite service via the gateway. The service responds by publishing creation events to the products, recommendations, and reviews topics, which are consumed by the three main microservices in parallel and asynchronously. The events are stored in the database of each microservice. The unknowns represent the interaction with the message broker, either by publishing or consuming an event.
Distributed tracing with Spring Cloud Sleuth and Zipkin
With the introduction of Spring Cloud Sleuth and Zipkin, we have seen an example of distributed tracing for the processing of an external synchronous HTTP request, which includes the asynchronous transmission of events between the involved microservices.
Application
To enable distributed tracing using Spring Cloud Sleuth and Zipkin, here are the steps to follow:
- Add dependencies to integrate Spring Cloud Sleuth and the ability to send trace information to Zipkin in the build files.
- Add dependencies for RabbitMQ and Kafka in the projects that have not used them before, namely Spring Cloud authorization-server, eureka-server, and gateway projects.
- Configure the microservices to send trace information to Zipkin using RabbitMQ or Kafka.
- Add a Zipkin server to the Docker Compose files.
- Add the Springkafka profile in docker-compose-kafka.yml for the Spring Cloud authorization-server, eureka-server, and gateway projects.
- Use a Docker image published by the Zipkin project to run the Zipkin server as a Docker container.
To use Spring Cloud Sleuth and send trace information to Zipkin, it is necessary to add dependencies in the Gradle build file, build.gradle.
 implementation 'org.springframework.cloud:spring-cloud-starter-sleuth'
implementation 'org.springframework.cloud:spring-cloud-sleuth-zipkin'
For Gradle projects that have not used RabbitMQ and Kafka before, the following dependencies should be added:
 implementation 'org.springframework.cloud:spring-cloud-starter-stream-rabbit'
implementation 'org.springframework.cloud:spring-cloud-starter-stream-kafka'
The configuration to use Spring Cloud Sleuth and Zipkin should be added to the common configuration file, config-repo/application.yml. In the default profile, it is specified that trace information will be sent to Zipkin using RabbitMQ:
 implementation 'org.springframework.cloud:spring-cloud-starter-stream-rabbit'
implementation 'org.springframework.cloud:spring-cloud-starter-stream-kafka'
The configuration to use Spring Cloud Sleuth and Zipkin should be added to the common configuration file, config-repo/application.yml. In the default profile, it is specified that trace data will be sent to Zipkin using RabbitMQ.
spring.zipkin.sender.type: rabbit
In the default profile, Spring Cloud Sleuth only sends 10% of traces to Zipkin by default. To ensure that all traces are sent to Zipkin, the following property should be added:
spring.sleuth.sampler.probability: 1.0
When sending traces to Zipkin via Kafka, the Spring Kafka profile should be used. In this profile, we override the default profile parameter so that trace information is sent to Zipkin using Kafka:
 ---


spring.config.activate.on-profile: kafka
spring.zipkin.sender.type: kafka
Finally, the gateway service requires a parameter in the config-repo/gateway.yml configuration file to allow Sleuth to properly track tracing IDs:
spring.sleuth.reactor.instrumentation-type: decorate-on-last
Adding Zipkin to Docker Compose files
As mentioned earlier, the Zipkin server is added to the Docker Compose files using the existing Docker image openzipkin/zipkin, published by the Zipkin project. In the docker-compose.yml and docker-compose-partitions.yml files where RabbitMQ is used, the definition of the Zipkin server is as follows:
   zipkin:
    image: openzipkin/zipkin:2.23.2
    mem_limit: 1024m
    environment:
      - RABBIT_ADDRESSES=rabbitmq
      - STORAGE_TYPE=mem
    ports:
      - 9411:9411
    depends_on:
      rabbitmq:
        condition: service_healthy
The configuration of the Zipkin server in docker-compose-kafka.yml is as follows:
- The Docker image used is openzipkin/zipkin version 2.23.2.
- The environment variable RABBIT_ADDRESSES is set to "rabbitmq" to indicate that Zipkin will receive tracing information via RabbitMQ and will connect to RabbitMQ using the hostname "rabbitmq".
- The environment variable STORAGE_TYPE is set to "mem" to specify that all trace information will be stored in memory.
- The memory limit is increased to 1024 MB for Zipkin, compared to 512 MB for the other containers, because Zipkin will consume more memory than the other containers due to storing all trace information in memory.
- Zipkin exposes HTTP port 9411 to allow web browsers to access its web user interface.
- Docker will wait for the RabbitMQ service to signal that it is healthy before starting the Zipkin server.
Storing trace information in memory in Zipkin is acceptable for development and testing activities, but in a production environment, it is recommended to configure Zipkin to store trace information in a database such as Apache Cassandra, Elasticsearch, or MySQL.
   zipkin:
    image: openzipkin/zipkin:2.23.2
    mem_limit: 1024m
    environment:
      - STORAGE_TYPE=mem
      - KAFKA_BOOTSTRAP_SERVERS=kafka:9092
    ports:
      - 9411:9411
    depends_on:
      - kafka
The following source code is a configuration for using Zipkin with Kafka in the context of Spring Cloud:
- The configuration to use Zipkin with Kafka is similar to the one to use Zipkin with RabbitMQ.
- The main difference is in the use of the environment variable KAFKA_BOOTSTRAP_SERVERS=kafka:9092 to specify that Zipkin will use Kafka to receive trace information, and will connect to Kafka using the hostname "kafka" and port 9092.
- Docker will wait for the Kafka service to be up and running before starting the Zipkin server.
- In docker-compose-kafka.yml, the Spring Kafka profile is added to the Spring Cloud eureka, gateway, and auth-server services.
 environment:
  - SPRING_PROFILES_ACTIVE=docker,kafka
To test distributed tracing, we will follow the following steps:
- Create, start, and verify the system landscape with RabbitMQ as the queue manager.
- Send a successful API request and verify the trace information linked to it in Zipkin.
- Send an unsuccessful API request and verify the error information in Zipkin.
- Send a successful API request that triggers asynchronous processing and verify how its trace information is represented in Zipkin.
- Discover how to monitor the trace information transmitted to Zipkin in RabbitMQ.
- Change the queue manager to Kafka and repeat the previous steps.
Starting the System with RabbitMQ as the Queue Manager
./gradlew build && docker-compose build
To be able to call the API, you first need to obtain an access token by executing the following commands:
 unset ACCESS_TOKEN
ACCESS_TOKEN=$(curl -k https://writer:secret@localhost:8443/oauth2/token -d grant_type=client_credentials -s | jq -r .access_token)
echo $ACCESS_TOKEN
Sending a Successful API Request
Now that we have obtained an access token, we are ready to send a normal request to the API. Please execute the following command:
curl -H "Authorization: Bearer $ACCESS_TOKEN" -k https://localhost:8443/product-composite/1 -w "%{http_code}\n" -o /dev/null -s
After sending a successful API request, we can launch the Zipkin user interface to see the tracing information that was sent to Zipkin by following these steps:
- Open the following URL in your web browser: http://localhost:9411/zipkin/.
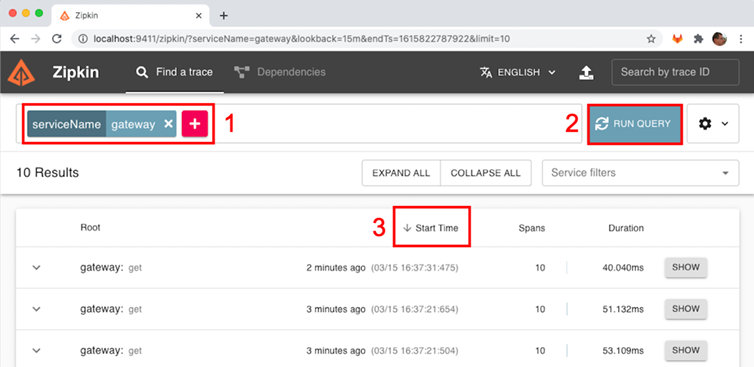
- To find the trace information for our request, look for traces that went through the gateway service. To do this, click the big plus sign (+) and select "serviceName," then "gateway."
- Click the "RUN QUERY" button.
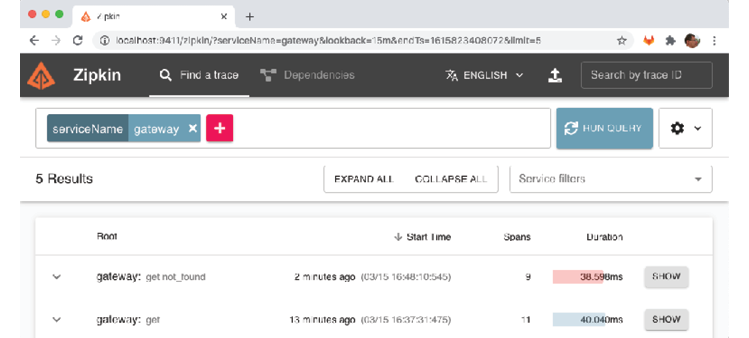
- Click the "Start Time" header to see the results sorted in reverse chronological order (a down arrow should be visible to the left of the "Start Time" header).
You should see the trace information for your successful API request. The HTTP status code of the request should be 200.
- The tracing information for our previous API request will be the first in the list. Please click the SHOW button to see the trace details:
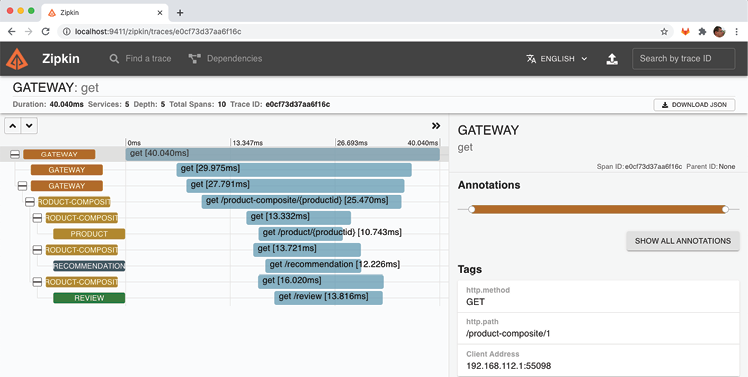
In the detailed view of the trace information, we can observe the following elements:
- The request was received by the gateway service.
- The gateway service delegated the request processing to the product-composite service.
- The product-composite service sent three parallel requests to the main services: product, recommendation, and review.
- Once the product-composite service received the response from the three main services, it created a composite response and returned it to the caller via the gateway service.
- In the detailed view on the right, we can see the HTTP path of the actual request that we sent: "/product-composite/1".
Sending an Unsuccessful API Request
To see how trace information is represented for an unsuccessful API request, we will perform the following steps:
- Send an API request for a product ID that does not exist, for example, ID 12345, and verify that it returns the HTTP status code for "Not Found," which is 404:
curl -H "Authorization: Bearer $ACCESS_TOKEN" -k https://localhost:8443/product-composite/12345 -w "%{http_code}\n" -o /dev/null -s
- In the Zipkin user interface, go back to the search page (use the back button in your web browser) and click the "RUN QUERY" button again. To see the results sorted in reverse chronological order, click the "Start Time" header. You should see the failed request at the top of the returned list. Note that its duration bar is red, indicating that an error occurred. Click its "SHOW" button to see the details.
- Here you will see the path of the request that caused the error, "/product-composite/12345", as well as the error code: 404 (Not Found). The red color of the bar indicates that the request to the product service caused the error. This information is very useful for determining the root cause of a failure!
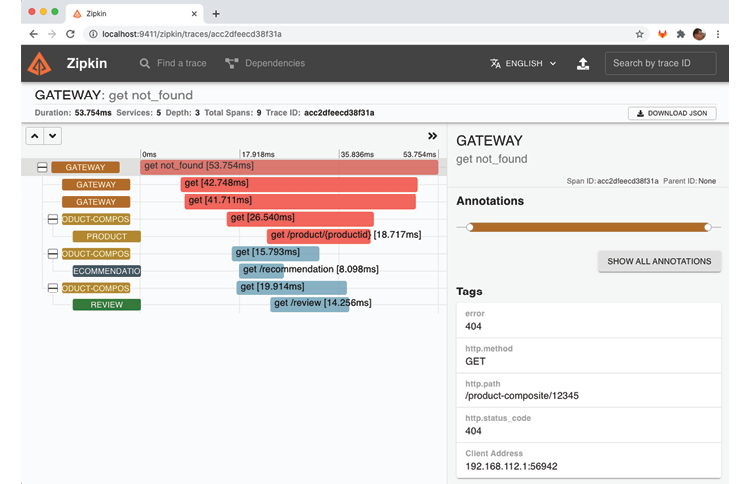
When an unsuccessful API request is made, we can see the corresponding trace information in the Zipkin user interface. The path of the request that caused the error is displayed, in this case "/product-composite/12345", as well as the error code: 404 (Not Found). The red color of the bar indicates that the request to the product service caused the error. This information is very useful when analyzing the root cause of a failure!
Sending an API Request that Triggers Asynchronous Processing
The third type of request that we can observe in the Zipkin user interface is a request where some parts of its processing are done asynchronously. We will perform a delete request where the delete process in the main services is done asynchronously. Here are the steps to follow:
- Execute the following command to delete the product with an ID of 12345, and verify that it returns an HTTP status code of 200 on success:
curl -X DELETE -H "Authorization: Bearer $ACCESS_TOKEN" -k https://localhost:8443/product-composite/12345 -w "%{http_code}\n" -o /dev/null -s
This will trigger asynchronous processing in the main services. 2. Open the Zipkin user interface and perform a search for the product-composite service following the steps described above. You should see the delete request in the list. 3. Click on the "SHOW" button to view the request details. You should see that the request triggered delete events in the main services, which were sent to the message broker. 4. Click on the "product.delete" event, then on "Find matching traces". You should see trace information for the product service's delete event. The blue bars indicate that the processing was done asynchronously. 5. Repeat steps 3 and 4 for the delete events sent to the recommendation and review services. You should see trace information for these events and the blue bars indicating that the processing was done asynchronously.
To view the results sorted by descending chronological order in the Zipkin user interface, go back to the search page using the browser back button. Then, click on the "RUN QUERY" button. To sort the results by start time, click on the "Start Time" header. You can expect to get a similar result to the screenshot below:
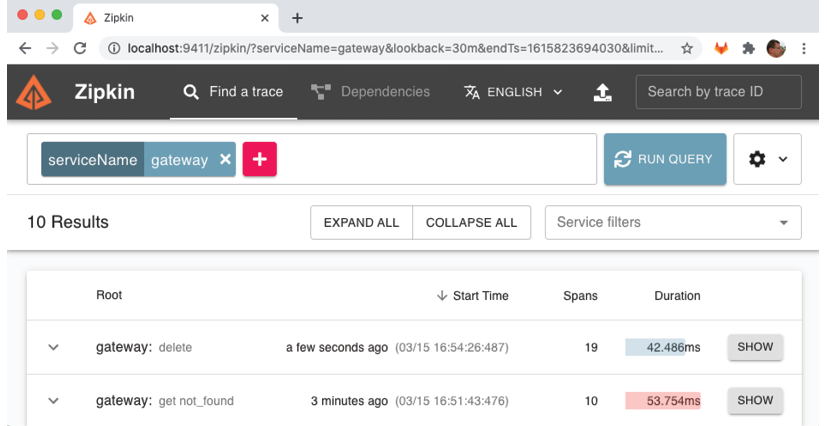
After sorting the results by descending chronological order, you should see the delete request at the top of the returned list. It should be noted that the root service name, "gateway", is suffixed by the HTTP method used, "delete". To view the details of this delete request, click on the corresponding "SHOW" button.
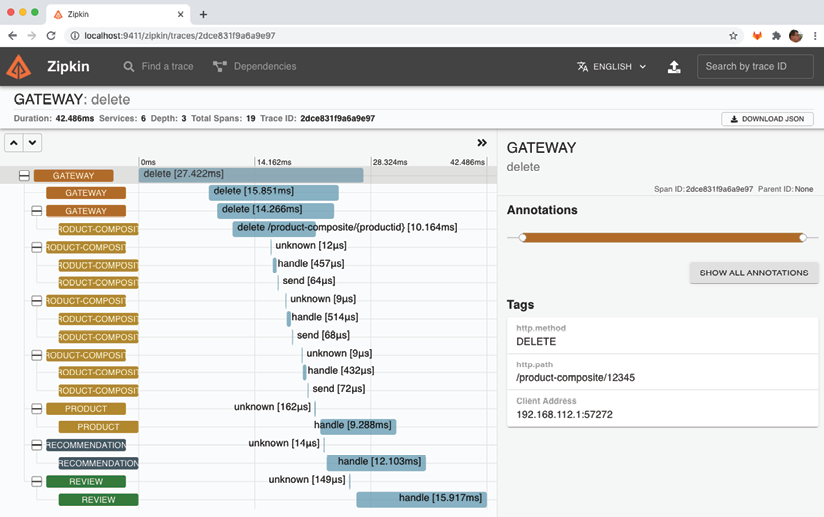
The trace information for the delete request processing is displayed here:
- The delete request was received by the "gateway" service.
- The "gateway" service delegated the request processing to the "product-composite" service.
- The "product-composite" service published three events to the message broker (RabbitMQ, in this case).
- The "product-composite" service returned a successful HTTP status code 200, via the "gateway" service, to the caller.
- The main services (product, recommendation, and review) received the delete events and began processing them asynchronously, i.e., independently of each other.
To confirm the message broker's involvement, click on the first span of the "product" service:
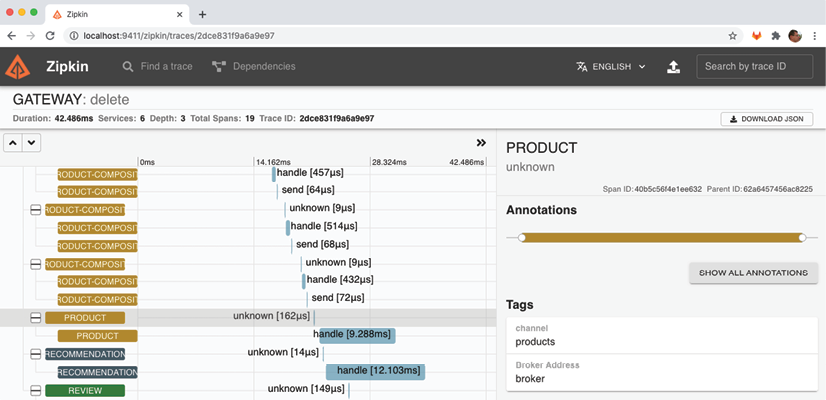
In the selected range, the given name, "unknown", is rather useless. However, in the "Tags" section of the selected range, located on the right, we can find more interesting information. We discover that the "product" service was triggered by a message delivered to its input channel, named "products". Additionally, the name of the message broker used, "broker", is visible in the "Broker Address" field.
In summary, in this section, we have learned how to use distributed tracing to understand how our microservices collaborate. We have learned how to collect trace information using Spring Cloud Sleuth and store and visualize this information with Zipkin. To promote decoupling of runtime components, we have learned how to configure microservices to send trace information asynchronously to the Zipkin server, using RabbitMQ and Kafka as message brokers. We have seen how adding Spring Cloud Sleuth to microservices is easy with the addition of a few dependencies to build files and configuration of some parameters. Finally, we have seen how the Zipkin user interface allows for quick identification of which part of a complex workflow caused unexpected response time or error, and how it allows for visualization of both synchronous and asynchronous workflows.