Introduction
In supervised learning, we are provided with a dataset that includes both input features x and target outputs y. This allows us to fit an algorithm to the data and learn a decision boundary to predict the target output y. However, in unsupervised learning, we are only given a dataset with input features x, but not the target outputs y. As a result, we cannot tell the algorithm what the "right answer" is, and instead, we ask the algorithm to find interesting structure or patterns in the data.
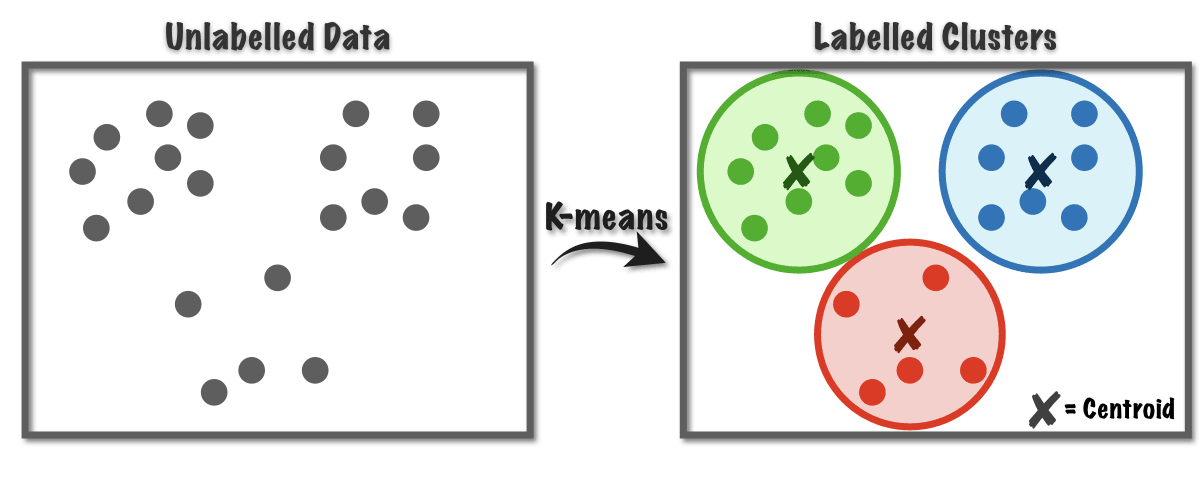
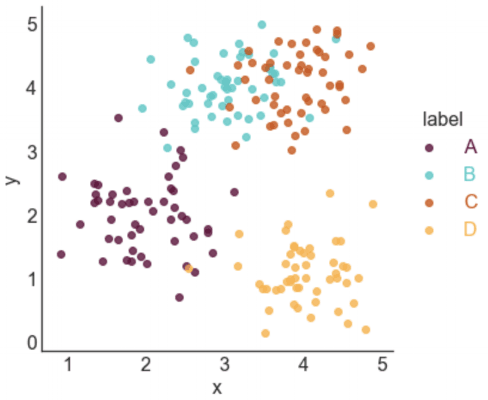
One popular type of unsupervised learning algorithm is clustering, which looks for groups of points that are similar to each other. The goal of clustering is to group the data into clusters that share some common characteristics. For example, clustering can be used to group similar news articles together or to group individuals with similar genetic traits.
There are many applications of clustering in different fields, such as astronomy and space exploration. Astronomers use clustering to group bodies in space together to understand the structure of galaxies or to identify coherent structures in space. Another application of clustering is market segmentation, where companies group customers with similar buying habits to create targeted marketing campaigns.

The most commonly used clustering algorithm is the k-means algorithm, which involves finding a set of k centroids that define the clusters. The algorithm assigns each data point to the nearest centroid and recalculates the centroids until convergence. In the next section, we will explore the k-means algorithm and how it works.
Clustering is a popular unsupervised learning algorithm that can be used in various fields, including market segmentation, DNA analysis, and astronomy. The k-means algorithm is a widely used clustering algorithm that can help identify clusters of data with common characteristics.
K-means intuition
To explain how the K-means clustering algorithm works, here are some mathematical examples. We have a dataset containing 30 unlabeled training examples, and the goal is to run K-means on this dataset.

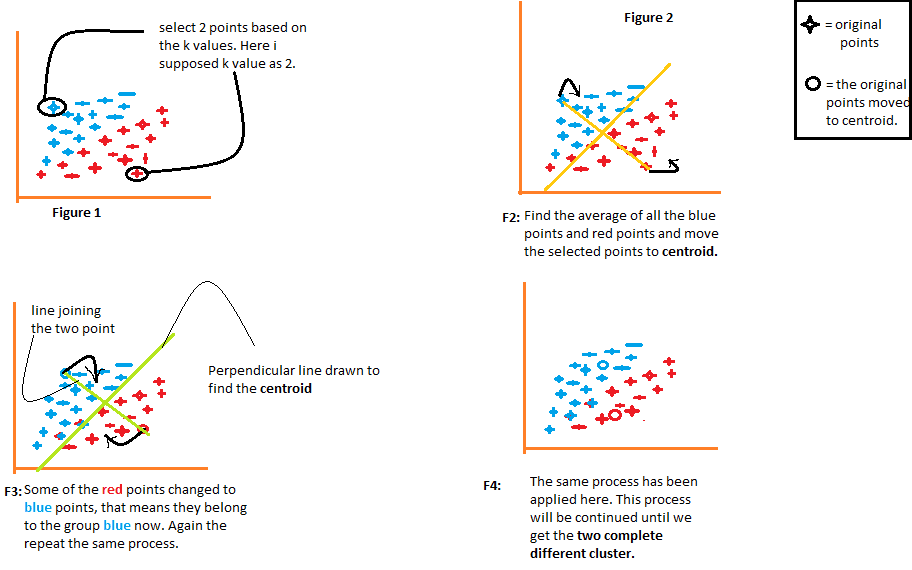
The first step of the K-means algorithm is to take a random guess at the centers of the two clusters that you want to find. In this example, we are trying to find two clusters. Later, we will see how to decide on the number of clusters to find. But to start, K-means chooses two random points, shown here as a red cross and a blue cross, to be the centers of two different clusters. This is a random guess and not particularly good, but it's a start.

K-means then performs two different actions in a loop. The first action is to assign each point to a cluster centroid, and the second is to move the cluster centroids. To assign each point to a cluster centroid, K-means first determines for each point whether it is closer to the red cross or the blue cross. Then it associates each point with the nearest cluster centroid. Points associated with the red cross are painted in red, and those associated with the blue cross are painted in blue. This is the first of the two steps that K-means performs in a loop.
The second step is to move the cluster centroids by calculating the average of all the points associated with each cluster centroid. The cluster centroids are moved to the new mean positions, and K-means repeats the two steps until there are no more changes. In the example, K-means finds that the points at the top correspond to one cluster and the points at the bottom to another cluster.
K-means is a clustering algorithm that uses two steps to cluster data. The first step is to assign each point to a cluster centroid, and the second is to move the cluster centroids by calculating the average of all the points associated with each centroid. By repeating these two steps, K-means can find clusters in the data.
Algorithm
The K-means clustering algorithm involves randomly initializing K cluster centroids, which are vectors with the same dimension as the training examples. K-means then repeats two steps: assigning each training example to the cluster centroid closest to it and updating the cluster centroids to be the mean of the points assigned to each cluster. The algorithm iterates until convergence, which occurs when the cluster assignments no longer change or the change falls below a certain threshold.
The distance between a training example and a cluster centroid is computed using the L2 norm, which can be minimized to find the index of the closest cluster centroid. To simplify computation, the squared distance is often used instead. If a cluster has no training examples assigned to it, it is typically eliminated.
While K-means is often used for data sets with well-separated clusters, it can also be applied to data sets where the clusters are not clearly separated. For example, K-means can be used to group people by height and weight to determine the optimal sizing for t-shirts.
The K-means algorithm can be viewed as optimizing a specific cost function, which measures the sum of squared distances between each training example and its assigned cluster centroid. By minimizing this cost function, K-means is able to find a clustering of the data that is relatively tight and compact. The algorithm typically converges in practice, although it is possible for it to get stuck in local optima or take a long time to converge for large data sets.
Optimization
This cost function, J, is a function of the assignments of points to clusters and the locations of the cluster centroids. To understand the cost function, we use the notation CI to represent the index of the cluster to which training example XI is currently assigned, and mu subscript CI to represent the location of the centroid of the cluster to which XI has been assigned. The cost function J is defined as the average of the squared distance between every training example XI and the centroid mu subscript CI to which it has been assigned. The K-means algorithm works by updating the assignments of points to clusters and the locations of the cluster centroids in order to minimize J.

The K-means algorithm has two main steps. In the first step, it assigns each training example to the closest centroid in order to minimize J while holding the centroid locations fixed. In the second step, it moves the centroids to the mean of the points assigned to them in order to minimize J while holding the assignments of points to clusters fixed.

By optimizing the cost function J, the K-means algorithm is guaranteed to converge on every iteration, meaning that the distortion cost function should go down or stay the same. If the distortion cost function ever goes up, it means there is a bug in the code. To test if the algorithm has converged, we can check if the cost function has stopped going down. If the cost function is going down very slowly, we may choose to stop the algorithm as the convergence is good enough.
The cost function J can also be used to take advantage of multiple random initializations of the cluster centroids. By running the K-means algorithm with different random initializations, we can compare the resulting cost functions to choose the best initialization.
Initializing K-means

When running K-means, the number of cluster centroids K should be less than or equal to the number of training examples m. Otherwise, there will not be enough training examples to have at least one training example per cluster centroid.
The most common way to choose the cluster centroids is to randomly pick K training examples. This method initializes the cluster centroids mu K to be equal to these K training examples. The algorithm then runs to convergence, giving a choice of cluster assignments and cluster centroids.
However, there is a chance that the initialization of the cluster centroids may result in suboptimal local optima, which can lead to a poor clustering of the data. To address this issue, it is recommended to run K-means with multiple random initializations to give it a better chance of finding the best local optimum.
To implement this, one can run K-means multiple times using different random initializations, such as 50 to 1000 times. After doing this, the set of clusters that gives the lowest distortion (cost function) is selected. This approach can often give a much better result than if only one random initialization was used.
The K-means algorithm involves the partitioning of data points into K distinct clusters. Random initialization is the most common way to choose the cluster centroids, but running the algorithm with multiple random initializations can often lead to a better clustering of the data.
Choose the number of cluster
In the context of clustering, K is the number of clusters you want to create from a given dataset. However, determining the appropriate value of K is often ambiguous and subjective. For instance, different people might see different numbers of clusters when looking at the same dataset.
To address this issue, there are several techniques to help you choose the value of K. One such technique is called the elbow method. The idea is to run the K-means algorithm with a variety of values of K, and plot the cost function or distortion function J as a function of the number of clusters. When you have few clusters, say one cluster, the cost function will be high. As you increase the number of clusters, the cost function will go down. If the curve looks like the bend of an elbow, with a rapid decrease followed by a more gradual one, then the value of K that corresponds to the elbow is usually chosen as the appropriate number of clusters.
However, in practice, the elbow method may not always be the best approach. Cost functions for some datasets might not have a clear elbow. In such cases, it is often better to evaluate K-means based on its performance for the intended downstream purpose. For example, if you are using K-means to cluster a dataset of t-shirt sizes, you may want to consider the trade-off between how well the t-shirts will fit (depending on whether you have three sizes or five sizes) and the extra costs associated with manufacturing and shipping five types of t-shirts instead of three. In this case, you may run K-means with K equals 3 and K equals 5 and then compare the two solutions based on the trade-off between fit and cost. If K=3 so c(i) can be : 1,2 ou 3
Another example where K-means can be applied is image compression. In this case, there is a trade-off between the quality of the compressed image and the amount of space saved. By adjusting the value of K, you can manually decide on the best balance between these two factors.
While choosing the right value of K for clustering can be ambiguous, there are several methods to help make an informed decision, such as the elbow method. Ultimately, the best choice of K depends on the specific application and the trade-offs involved.

 English


